By Steve Klosterman, Senior Data Scientist at Tala
This post is a followup to my deep dive on the mechanics of uplift modeling, with a worked example. Here I describe how we on the Data Science team at Tala applied uplift modeling to help past-due borrowers repay their loans. Tala offers the world’s most accessible consumer credit product, instantly underwriting and then disbursing loans to people who have never had a formal credit history, all through a smartphone app.
Introduction
Of the many ways that machine learning can create value for businesses, uplift modeling is one of the lesser known. But for many use cases, it may be the most effective modeling technique. In any situation where there is a costly action a business can selectively take for different customers, in hopes of influencing their behavior, uplift modeling should be a strong candidate for finding that subset of customers that would be most influenced by the action. This is important for maximizing the return on investment in a business strategy.
In this post, I’ll outline the business problem we tackled with uplift modeling at Tala, the basics of uplift models and how we built one, how the predictions of uplift models can be explained, how the uplift concept can be extended to provide direct financial insights, and considerations for monitoring the performance of uplift models in production.
Use case at Tala: past-due borrowers
When borrowers go past due on their loans, they put their own financial health at risk, as well as the health of the business that lent to them. One of Tala’s primary means for reaching out to past-due borrowers and encouraging them to repay their loans is via telephone. However, this is an expensive process and must be balanced with the expected increase in revenue that a phone call will bring: how much more likely is it that a borrower will make a payment if we call them?
Mathematically, we are interested in the uplift in probability of payment due to calling a borrower. This is defined as the difference in probability of payment if the borrower is called, versus if they aren’t called.
Uplift= P(payment with phone call) – P(payment without phone call
The premise of uplift modeling is that it can help us identify the borrowers who will have the biggest increase in repayment probability if given a phone call. In other words, those who are more persuadable. If we can identify these borrowers, we can more effectively prioritize our resources to maximize both borrowers’ and Tala’s financial health.
Focusing on the opportunity
Now that we know the goal of uplift modeling, how do we get there? Uplift modeling relies on randomized, controlled experiments: we need a representative sample of all different kinds of borrowers in both a treatment group, who received a phone call, as well as a control group that wasn’t called.

Once we obtained this data set, we observed that the fraction of borrowers making a payment was significantly higher in the treatment group than the control group. This provided evidence that phone calls were “working” in the sense that they effectively encouraged repayment on average across all borrowers. This is called the average treatment effect (ATE). Quantifying the ATE is the typical outcome of an A/B test.
However, it may be that only a portion of borrowers within the treatment group were responsible for most of the ATE we observed. As an extreme example, maybe half of the borrowers in the treatment group were responsible for the entire ATE. If we had some way to identify this segment of borrowers ahead of time, who would more readily respond to treatment, then we would be able to concentrate our telephonic resources on them, and not waste time on those for whom phone calls have little or no effect. We may need to find other ways to engage the non-responders. The process of determining variable treatment effects from person to person, conditional on the different traits these people have, means we’re looking for the conditional average treatment effect (CATE). This is where machine learning and predictive modeling come into the picture.
Building and explaining the uplift model
In machine learning, we can describe the differences between borrowers via features, which are various quantities specific to a borrower. We engineered features related to borrowers’ history of payment, as well as results of past phone calls and interactions with the Tala app. The features attempt to characterize a borrower’s willingness and capacity to repay, as well as their commitment to establishing and maintaining a relationship with Tala. Will the borrower listen to and learn from us, and give us the opportunity to do the same with them?
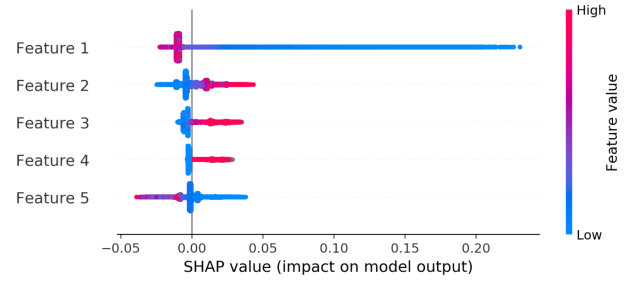
Armed with the features and modeling framework described above, we were ready to build our uplift model. We used an approach called the S-Learner. For details on this, see my previous blog post on uplift modeling. Once the S-Learner was built and tested, we trained a separate regression model on the training set with a target variable of uplift (the difference in predicted probabilities given treatment and no treatment), and the same features used to train the S-Learner (except for the treatment flag, which is considered a feature in the S-Learner approach). Using the testing set SHAP values from this regression model, we were able to gain insight into which model features had the largest impact on predictions of uplift.
Although the feature names are anonymized here, the interpretation of the most predictive features all made sense in that the borrowers who demonstrate willingness to pay, have experience with borrowing and may want to borrow again, and are receptive to telephonic outreach, are the kinds of borrowers worth encouraging to repay via phone calls.
Designing strategies to use and monitor the model
Knowing the predicted uplift in probability was the first step in our model-guided strategy. However, we are not just interested in how much more likely someone is to make a payment, but also the likely increase in the amount of payment due to phone outreach. To determine this, we combined the uplift in probability with information about the amount owed by a borrower and the likely amount of payment. This turned the predicted uplift in probability into an estimate of the revenue uplift due to the phone call, allowing us to rank borrowers on how valuable it would be to call them.
The opportunity represented by ranking borrowers on predicted revenue uplift can be seen by calculating the actual revenue uplift, as the difference in average revenue between treatment and control groups, for different bins of predicted revenue uplift. Such an analysis is analogous to the idea of an uplift decile chart detailed here. We used the model testing set for this.
Revenue uplift decile chart: Difference in revenue between treatment and control when ranking accounts by predicted revenue uplift
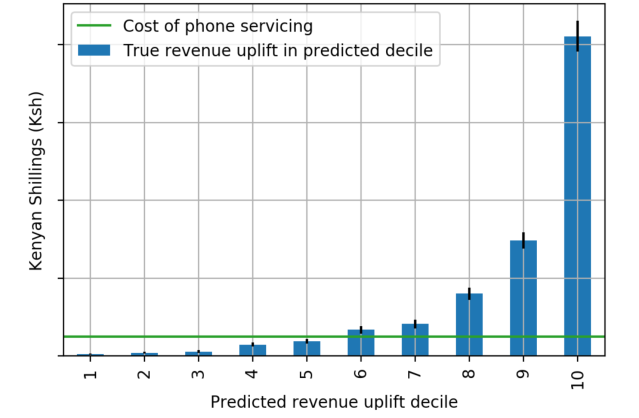
The results show that predicted revenue uplift effectively identifies accounts where phone calls are of more value. Over half of the incremental revenue available by calling all borrowers can be obtained by calling only the top 10% of borrowers ranked in this way, and 90% of the incremental revenue can be had by calling the top half of borrowers. In fact, when considering the average cost of telephonic outreach per borrower, shown as a green line, it’s apparent that only the top 50% of borrowers are profitable to call.
Given the apparent opportunity in using predicted revenue uplift to guide telephonic outreach, we deployed this model to guide our strategy. To monitor model performance after deployment, we created two groups that would enable us to examine the true uplift of phone calls, across the full range of predicted uplift. We did this by calling a randomly selected 5% of borrowers, no matter what their predicted uplift was, and not calling another 5%. Based on the results from these tests, we were able to conclude that the model was functioning as intended in production, using the same kind of model assessment metrics shown here and in my companion blog post.
In conclusion, uplift modeling allowed Tala to focus repayment efforts on borrowers who would be most receptive to those efforts, saving time and money. I hope you find this account of Tala’s experience with uplift modeling helpful for your work.